

Example
Internal Resonance Screening
Solutions for companies
01
The problem
In light, lightly damped structures (deployable booms, panels, instrument brackets), vibration modes can exchange energy through nonlinear effects when their frequencies form certain combinations (internal resonance). This transfer does not show up in a linear modal analysis and can contribute to unexpected responses and to fatigue. Avoiding such combinations is a classical rule of nonlinear dynamics (Nayfeh and Mook, Nonlinear Oscillations, 1979); our service is a practical application of that rule.
Flutter and other aeroelastic phenomena (coupling with the airflow) are outside the scope of the service.
02
How it works
Step 1
You send us your design frequencies: the natural frequencies of your structure (from finite elements, analytical calculation or modal testing) and, if known, the damping and the expected excitation band.
Step 2
We screen the frequency combinations: golden-ratio ladders and quadratic and cubic combinations close to internal resonance.
Step 3
You receive a report with the candidate combinations, their detuning, a review priority and where to focus testing or nonlinear analysis.
A frequency coincidence does not by itself imply risk: with realistic damping, many combinations never transfer energy. The report tells you what to review first; it is not a risk measurement and does not replace analysis or qualification testing.
Illustrative synthetic data
Screening input and output · CubeSat deployable boom
Input
Uniform boom modelled as a cantilever beam in planar bending. The first frequency, f₁ = 0.8 Hz, is an assumed value for the example. Assumed modal damping: 1 % (the NASA-STD-5002 default when no measurements are available).
| Mode | 1 | 2 | 3 | 4 | 5 | 6 | 7 |
|---|---|---|---|---|---|---|---|
| f (Hz) | 0.80 | 5.01 | 14.04 | 27.51 | 45.47 | 67.93 | 94.88 |
The detunings in the next table do not depend on f₁ or on the boom length: they recur in any uniform cantilever with these conditions. Only changes such as a tip mass, a change of cross-section or of stiffness modify them.
Output
| Detected combination | Type | Detuning | Review priority | Suggested test or analysis focus |
|---|---|---|---|---|
| ω₄ + ω₁ ≈ 2ω₃ | cubic | +0.82 % | 1 (high) | Forced sweep around mode 3, measuring the response of modes 1 and 4. |
| ω₆ + ω₂ ≈ ω₅ + ω₄ | cubic | −0.053 % | 2 (medium) | Mainly relevant under broadband random vibration (launch) exciting several modes at once; monitor modes 2, 4, 5 and 6. |
| ω₇ + ω₁ ≈ ω₆ + ω₄ | cubic | +0.25 % | 3 (low) | No specific test; keep on the watch list. |
| ω₇ ≈ ω₄ + ω₆ | quadratic (triad) | +0.59 % | — (conditional) | In an ideal straight cantilever this triad does not couple, by symmetry. Review it only if there is initial curvature, preload, gravity sag, asymmetry or joints. |
Detuning: relative difference between the two sides of the combination. The priority is a suggested review order, not a risk measure. If the expected excitation band included higher modes (8–10), further near-exact combinations would appear and should be added to the review.
Frequency coincidence does not imply risk. With realistic damping (≈ 1 %), a combination that is close in frequency may never transfer energy. Whether it does depends on the amplitude, coupling and damping of each design. Screening guides the review; it does not predict failures.
03
Technical document
The problem, our preliminary simulation results and the service are described in the document “Frequency ladders and internal resonance” (PDF).
04
Illustrative example
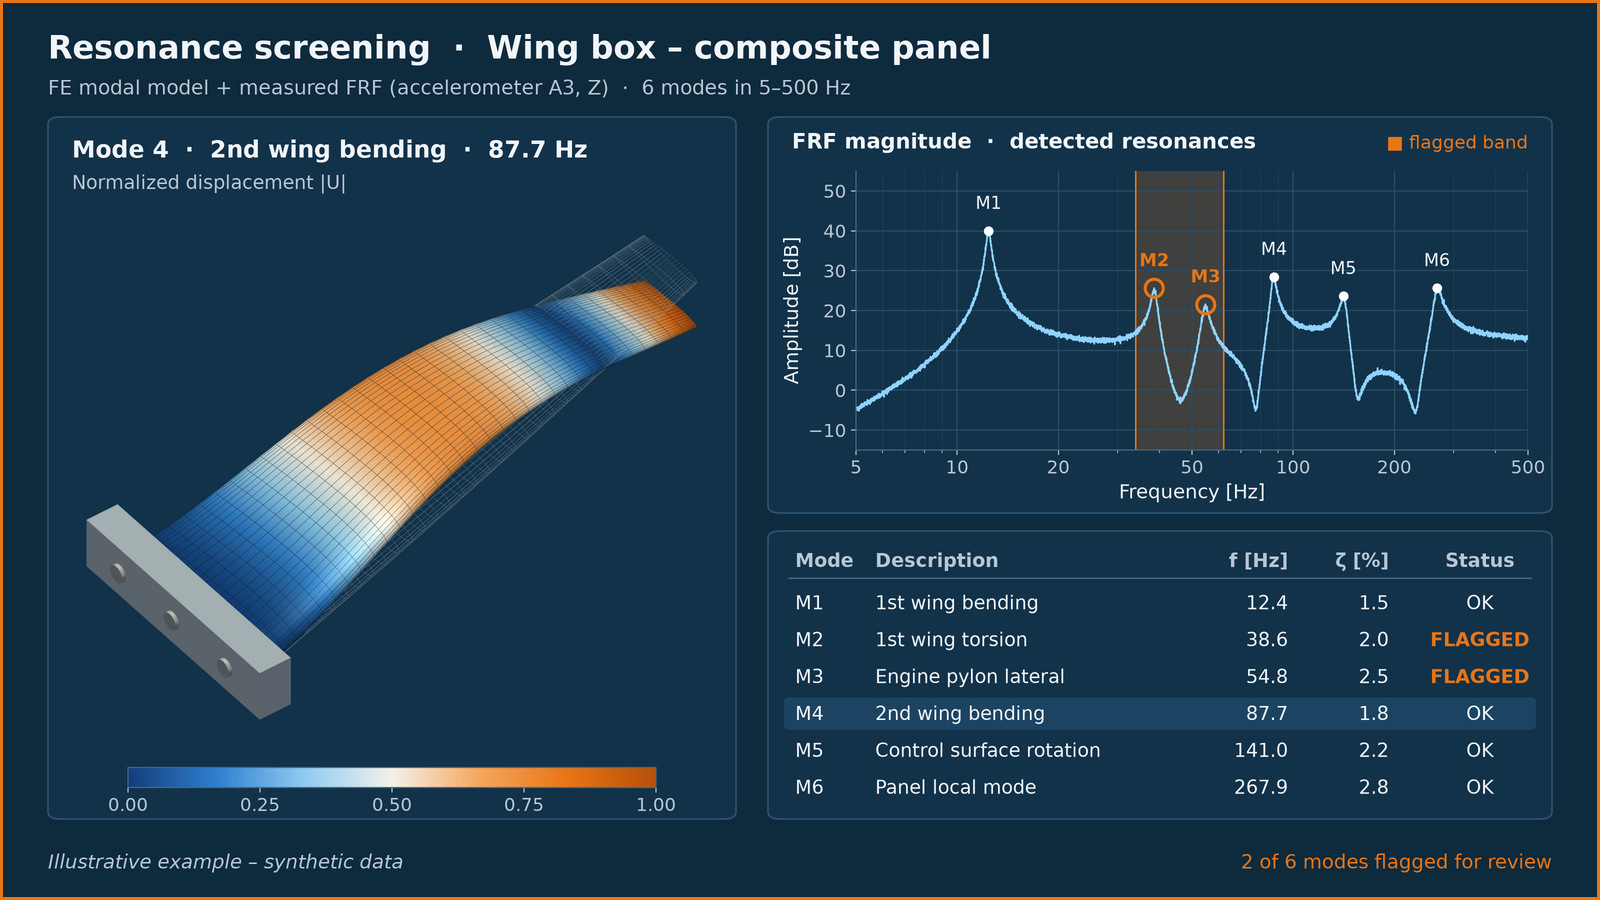
To see what goes in and what comes out, read the illustrative screening example for a CubeSat deployable boom (PDF). It is a scenario built on a textbook beam model: it is not a client or a real project.
05
Request a demo
If you would like us to review your design frequencies, contact us through the form: